U.S. Med Spa Industry Statistics and Market Insights
The U.S. med spa industry statistics indicate a robust market valuation exceeding $17.5 billion in 2023, with a projected compound annual growth rate of 14.5% through 2030. This growth is primarily driven by the increasing volume of minimally invasive aesthetic procedures, including neurotoxins, dermal fillers, and advanced laser treatments.
U.S. Med Spa Market Valuation and Growth Projections
The domestic med spa sector has transitioned from a niche market into a primary component of the U.S. healthcare and wellness economy. Data shows the average revenue per med spa facility now exceeds $1.9 million annually.
Investment trends highlight a significant influx of private equity capital, targeting multi-location expansion and operational consolidation. This institutional interest is fueled by high-margin service offerings and strong patient retention rates.
Geographic data indicates that California, Texas, and Florida remain the largest markets by facility count. However, per-capita spending is rising rapidly in secondary urban markets across the Midwest and Southeast.
Top-Performing Treatment Categories and Volume Data
Non-surgical aesthetic procedures represent the majority of revenue for U.S. facilities. Analysis of clinical volume reveals specific dominance in several key service categories.
Injectables and Neurotoxin Trends
Neurotoxins and dermal fillers account for approximately 50% of total service revenue in the typical med spa. Annual procedure volume for botulinum toxin type A has seen consistent year-over-year increases exceeding 10%.
Demographic shifts show an increase in “prejuvenation” patients, defined as individuals aged 25 to 35. This segment now accounts for nearly 25% of all injectable procedures performed in U.S. med spas.
Energy-Based Devices and Body Contouring
Laser hair removal and skin resurfacing remain foundational services, contributing significantly to equipment ROI. Body contouring, utilizing cryolipolysis and radiofrequency, has become a high-ticket growth driver.
Clinical data suggests that combination therapies—pairing energy-based treatments with topicals or injectables—are becoming the industry standard for optimizing patient outcomes and increasing average ticket prices.
Clinical Outcomes and Complication Rate Analysis
As procedure volume increases, the industry has placed a greater emphasis on clinical safety data. Standardized complication rates for non-surgical aesthetics remain low but require diligent monitoring.
- Injectable Adverse Events: Vascular occlusions and localized infections occur in less than 1% of documented clinical cases.
- Laser Safety: Thermal injuries or pigmentary changes are reported in approximately 2% of laser-based skin treatments.
- Training Impact: Facilities with standardized medical director oversight report a 30% lower rate of preventable clinical complications.
Adherence to evidence-based protocols and the utilization of ultrasound technology for filler placement are emerging trends aimed at further reducing complication rates.
Regulatory Landscape and Compliance Shifts
The regulatory environment for U.S. med spas is currently undergoing significant scrutiny. State medical boards are increasingly refining definitions regarding the “practice of medicine” in aesthetic settings.
Key regulatory focus areas include the requirement for a Good Faith Examination (GFE) prior to treatment. Compliance data suggests that 15% of facility audits result in citations related to improper mid-level practitioner supervision.
Ownership laws, specifically the Corporate Practice of Medicine (CPOM) doctrine, vary by state. Strict adherence to these structures is a critical factor for legal stability and successful investor due diligence.
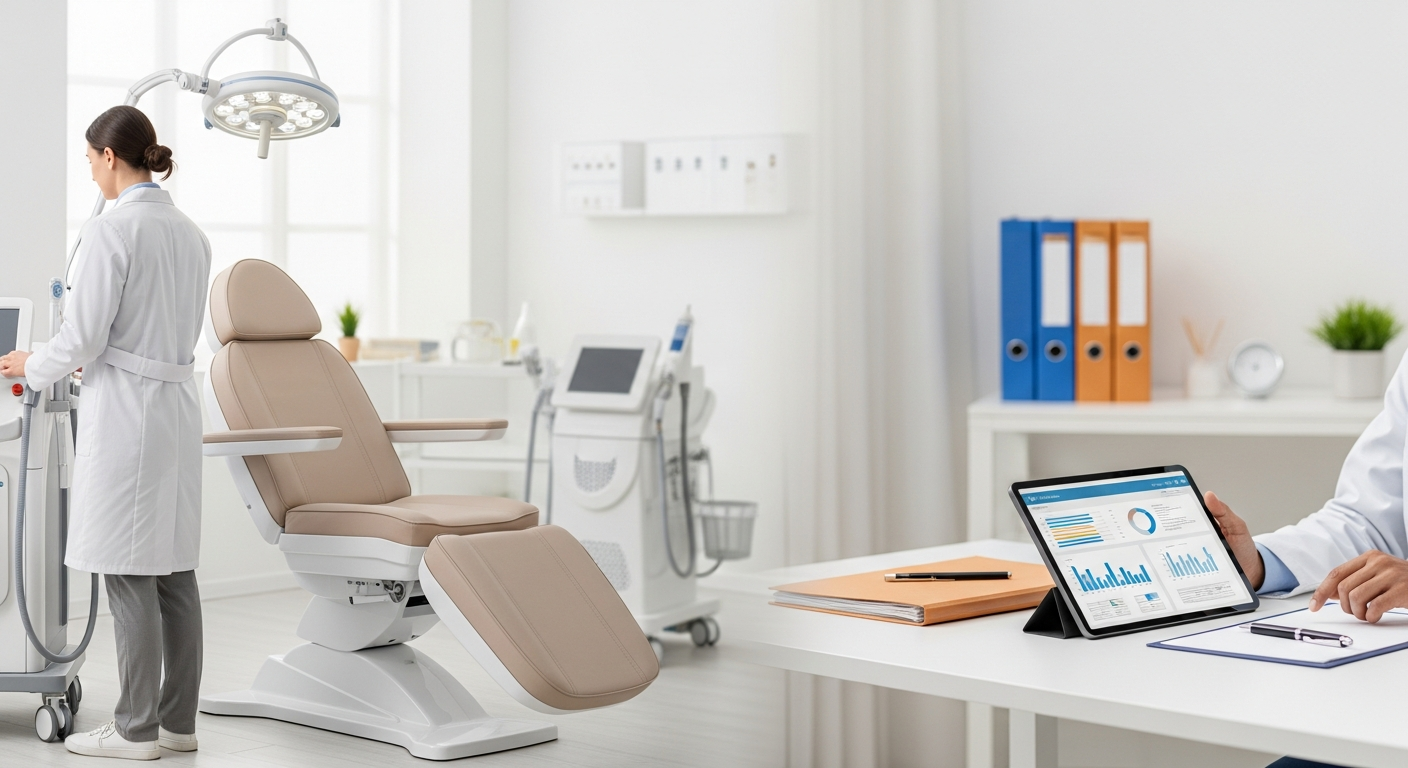
Med Spa Business Performance Metrics
Data-driven decision-making is essential for maintaining operational stability in a competitive market. Top-tier med spas track several key performance indicators (KPIs) to ensure long-term viability.
- Patient Acquisition Cost (PAC): Average costs range from $60 to $125 depending on the regional market.
- Retention Rate: Successful facilities maintain a patient retention rate of 65% or higher for injectable services.
- Revenue per Square Foot: This metric is increasingly used by investors to evaluate the efficiency of facility layouts.
Understanding these industry benchmarks allows owners to identify operational inefficiencies. Market data confirms that clinics prioritizing clinical excellence and regulatory compliance achieve higher valuation multiples during exits.